
Ask a supplier for the price of a sawdust pellet plant and you will get a number. Ask what the plant costs per ton to run, and the answers get vague fast. That vagueness is expensive: feedstock and energy decide whether a pellet project makes money, and both are known before you sign a single equipment contract. This guide breaks the per-ton cost of sawdust pelleting into its real components, shows where each published number comes from, and flags the assumptions that most commonly derail new projects.
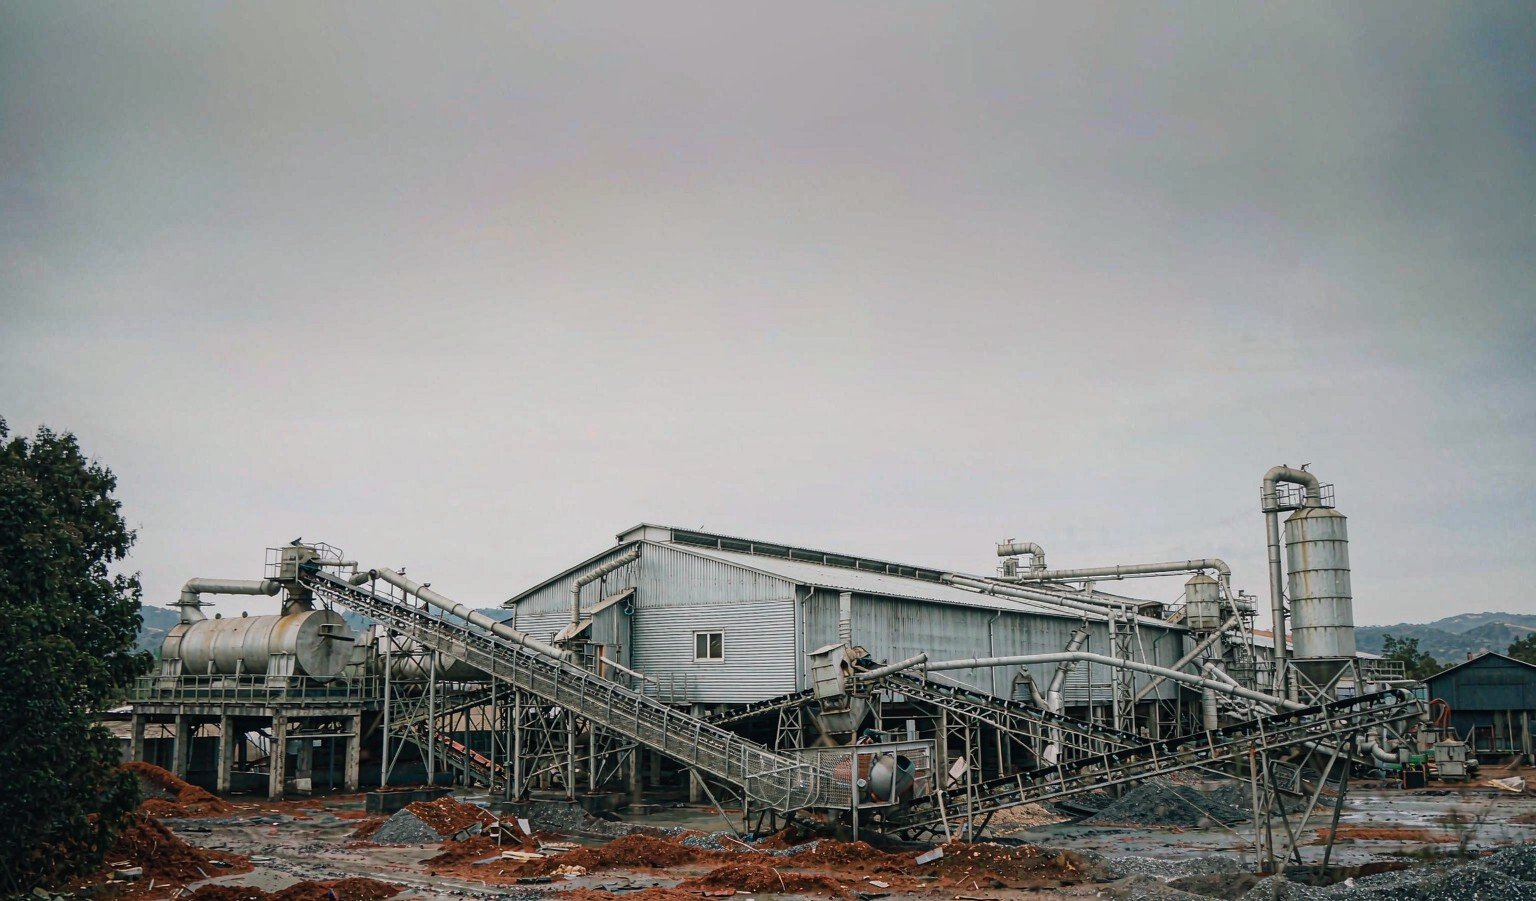
The figures below come from three kinds of sources: government statistics (US EIA), research compiled under IEA Bioenergy (unit energy data from Idaho National Laboratory work), and published worked examples from established equipment makers. Where a number is a vendor calculation rather than an independent measurement, we say so. Anything we could not trace, we left out.
The Cost Stack at a Glance
Every per-ton cost model for wood or sawdust pellets contains the same seven lines. The proportions move with scale and geography, but the structure does not.
| Cost component | Typical range (USD/t) | Share of total | Main driver |
|---|---|---|---|
| Raw material (sawdust, chips, residues) | 35–50 (purchased) | 40–60% | Distance to source, moisture |
| Electricity | 3–15 | 10–25% | Grind size, dryer fan, tariff |
| Drying fuel | 2–10 | 5–20% | Incoming moisture, fuel price |
| Wear parts (die, rollers, hammers, screens) | 1–3 | 3–6% | Abrasiveness, die quality |
| Labor | 1–5 | 2–8% | Automation level, wage rate |
| Packaging | 0–4 | 0–7% | Bags vs bulk tanker |
| Management and overhead | 2–4 | 3–7% | Site, permits, admin |
Ranges assembled from published industry worked examples and the sources cited per line below. A plant burning its own fines and running captive waste feedstock sits at the bottom of most ranges; a plant buying wet sawdust at a distance sits at the top.
Raw Material: The 40 to 60 Percent Line Item
Feedstock is the largest single cost in pellet production, and it is also the line most often misquoted. Two traps dominate.
Trap one: comparing prices at different moistures. Sawdust is usually sold wet. One published Chinese worked example (GEMCO, updated periodically since 2015) takes a spot price of ¥400/t for sawdust at roughly 38% moisture and shows that, once you pay to haul water and then dry it back out, the effective price at 8% moisture is about ¥571/t — a 43% penalty hidden inside the purchase price. The arithmetic is simple — divide the wet price by the fraction of actual dry matter — but buyers skip it constantly. When you compare two suppliers, normalize both quotes to the same moisture basis and to the same delivered point.
Trap two: paying haulage on water. Transporting sawdust at 50% moisture means every second truck is moving water. Plants that site within a short radius of sawmills, or that buy pre-dried planer shavings, start with a structural advantage that no equipment upgrade can recover later. The US EIA’s Monthly Densified Biomass Fuel Report tracks average feedstock cost per ton for US producers each month across its roundwood and residual categories, and it is the most honest public benchmark available when you sanity-check your own feedstock quotes.
If your own factory generates dry wood waste, the calculus changes entirely: captive feedstock at near-zero cost is the single strongest predictor of a fast payback in every cost model we have reviewed. The corollary matters too. A plant built on purchased feedstock should not be sized on the assumption that the cheapest supplier today will still be the cheapest in year three.
Energy: Electricity and Drying Heat
Energy splits into electrical load (grinding, conveying, pelletizing, cooling, dust collection) and thermal load (drying). They respond to different levers, so treat them separately.
The best public breakdown of electrical and thermal energy by process stage comes from Idaho National Laboratory trials compiled under IEA Bioenergy, reported by Yancey et al. (2013) for woody biomass:
| Unit operation | Specific energy (kWh/t) | What it tells you |
|---|---|---|
| Stage I grinding (chipping / coarse hogging) | 94 | Reducing chips is energy-intensive; avoid double-handling |
| Stage II grinding (hammer milling to pellet size) | 43 | Screen selection directly moves this number |
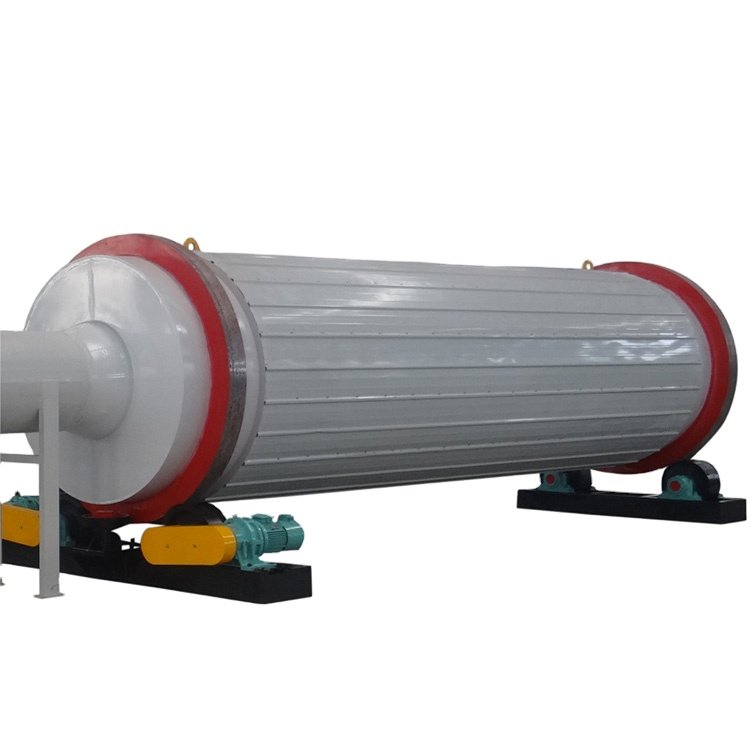
| Rotary drying | 340 | The dominant thermal consumer — mostly fuel, some fan power |
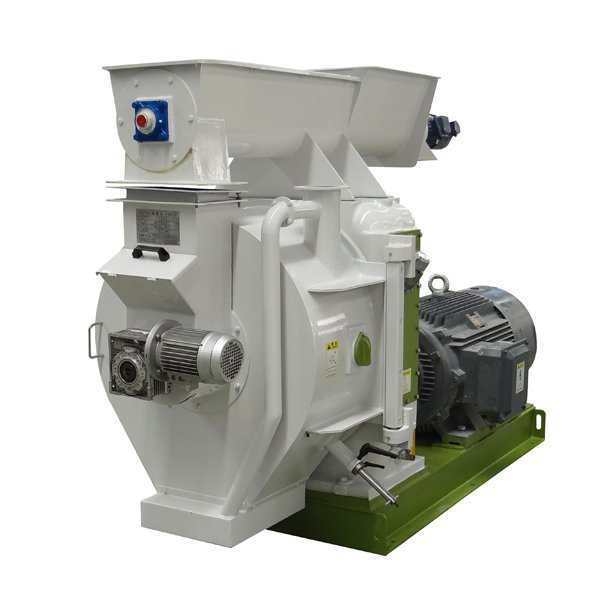
| Pellet mill | 49 | Friction work in the die; rises with wrong moisture |
Source: Yancey et al. 2013, Idaho National Laboratory, as presented in the IEA Bioenergy Task 40 webinar compilation (PDF). Values are for woody feedstock in a conventional flow sheet.
Read the dryer line twice. At 340 kWh/t equivalent, drying dominates everything else combined, which is why the moisture of purchased sawdust shows up in both the feedstock invoice and the fuel bill. One equipment-maker worked example (RICHI) prices a small dryer line at roughly 0.047 t of wood fuel per ton of raw material dried — about ¥16/t at their stated fuel price — which is realistic only when the drying fuel is cheap wood offcuts rather than purchased fuel.
On total electrical consumption, published Chinese worked examples converge on roughly 90 kWh per ton for the whole line including drying fan power, while vendor summaries of laboratory pelleting work place the pellet mill itself anywhere from 15 to 40 kWh/t depending on die, diameter, and preconditioning. The spread is wide because the inputs are wide: an abrasive, over-wet or over-dry feedstock can double the press energy without changing the nameplate.
Practical energy levers, in order of what they are worth:
- Dry with waste heat or own fines. Burning screened fines from your own production is standard practice; a boiler designed for it (rather than a hot air furnace fed with purchased fuel) converts a waste stream into drying capacity.
- Stop over-drying. Every point of moisture removed below your 8–10% target is fuel spent for nothing, and over-dry sawdust actually pellets worse.
- Right-size the grind. Stage II grinding energy scales with fineness. Grind to what your die needs, not finer.
- Run the press fully loaded. A pellet mill idling at part load consumes most of its power for a fraction of the output.
Wear Parts: Small Money That Becomes Big Money
Die and roller consumption looks trivial on a spreadsheet and then dominates the maintenance calendar. Industry summaries put ring die life for abrasive-free softwood sawdust in the 800–1,000 hour band for alloy dies, and closer to 300–500 hours for standard dies or abrasive feedstock; roller shells wear on a similar clock. On a 5 t/h line running 6,000 hours a year, that difference is the gap between one die change per year and six or more.
RICHI’s published worked example for a 1–1.5 t/h line allocates ¥4.5/t to die consumption and ¥2.5/t to roller shells — about USD 1/t combined at typical exchange rates. GEMCO’s example, on a smaller scale, lands near ¥16.7/t for all wear parts including lubrication. The honest conclusion from the spread: wear-part cost per ton is scale-dependent (larger dies process more tons before replacement) and feedstock-dependent, so model it with your own material rather than a brochure figure. If you are sizing a biomass line, our ring die specifications for feed and biomass pellet mills list the compression ratios and steel grades we match to sawdust work.
One warning from the field: the cheapest die is rarely the cheapest per ton. Our article on rice husk and ring die wear covers the abrasive-feedstock case in detail; the same logic — pay for hardened steel, recover it in service life — applies to high-bark sawdust.
Labor, Packaging and Overhead
These lines are smaller but they punish small plants disproportionately, because they barely scale.
- Labor. GEMCO’s four-operator example (drying/mixing, feeding, press control, bagging) costs ¥11,600/month and works out to ¥9.6/t at 1,200 t/month. Fully automated lines at larger capacity run 2–3 operators per shift and push labor under USD 2/t. At US or EU wage rates the same headcount costs ten times more per ton, which is why automation level is a purchasing decision, not a luxury.
- Packaging. 25 kg bags at 40 bags per ton cost ¥22/t in the published examples — real money for a commodity product. Bulk tanker delivery removes most of it, which is one reason utility-grade export pellets ship loose and residential pellets absorb the bag cost inside a premium price.
- Management and overhead. GEMCO allocates ¥16.7/t; treat this as site-specific and model your own.
A Worked Example: The Full Stack
Putting the published Chinese example together gives a concrete reference point — a small line (roughly 300 t/month) buying sawdust at ¥400/t at 38% moisture:
| Cost line | ¥/ton | Basis in the example |
|---|---|---|
| Raw material (normalized to 8% moisture) | 571 | ¥400/t at 38% moisture, corrected for water |
| Electricity (line + drying) | 90.7 | ~90 kWh/t at ¥0.83/kWh; drying fuel ¥16/t |
| Wear parts and maintenance | 16.7 | Dies, rollers, lubricants at small scale |
| Packaging (25 kg bags) | 22.0 | 40 bags × ¥0.55 |
| Labor (4 operators) | 9.6 | ¥2,900 × 4 per month ÷ 1,200 t |
| Operation and management | 16.7 | Site overhead allocation |
| Total (break-even) | ~743 | Excludes financing and depreciation |
Worked example from GEMCO’s published cost calculation; figures are illustrative of a small Chinese plant, not a quotation. Depreciation and interest are excluded — add your own capital recovery on top.
Note what the example does and does not include. It prices electricity at Chinese industrial tariffs and labor at Chinese wages; run the same plant in Poland or Vietnam and the totals shift, sometimes in opposite directions. What transfers is the structure: feedstock normalized for moisture, energy split by stage, wear parts modeled on your material, packaging chosen to match your market.
What Moves Your Cost Up or Down
Three findings from published analyses are worth internalizing before you finalize a plant design.
Scale helps less than you think. A supply-chain study hosted by NC State (cited in TCPEL’s line-design overview) modeled full production cost at €136/t for a 500,000 t/yr plant versus €143/t at 50,000 t/yr — a 5% gap, because bigger plants cut pelletizing cost but raise feedstock haulage and permitting cost. A 10-fold scale-up buys you little; a well-sited small plant with cheap feedstock beats a badly sited large one every time.
Opex breadth is narrow for good plants. Kingwood’s project-cost summary (payback-period analysis) puts total operating cost for fully automated wet-feed lines at USD 6–15/t excluding feedstock — electricity at 45–80 kWh/t, labor at USD 1–3/t, die and roller maintenance at USD 1–2.5/t — and identifies captive feedstock and utilization above 70% as the two conditions that pull payback toward two years.
Utilization is the quiet killer. Every cost-per-ton figure above assumes the plant actually runs. Feedstock supply volatility that drops utilization below 70% stretches payback by years, because fixed costs spread over fewer tons. This is why we tell clients to size the plant to the feedstock they can contract, not the feedstock they hope to buy.
Pricing Reality Check
Cost means nothing without a revenue side. The EIA’s June 2025 report puts US export prices at an average of $207.73/ton (717,018 t exported) and domestic sales at $235.49/ton (135,754 t) — and shows utility pellets dominating volume (780,390 t produced that month) over premium heating pellets (121,047 t). Two implications for a new producer:
- Export utility markets move enormous volume at a thinner margin; the total production cost stack (with feedstock) needs to land well under $200/t for the business to survive a bad quarter.
- Premium/domestic channels pay more per ton but demand certification discipline and packaging investment — the ENplus A1 requirements we walked through in our earlier article are the gatekeeper there.
Against the ~$743 RMB (roughly USD 100–105) break-even in the worked example, a $200+ export price looks comfortable — and would be, if feedstock and freight were as stable as a spreadsheet. In practice, plan for the feedstock line to drift up over the plant’s life and size your margin accordingly.
Capital Cost: Turning a Purchase Price into a Per-Ton Number
Equipment price is not a per-ton cost, but depreciation is — and the conversion is where many feasibility spreadsheets go soft. The published budget ranges for complete lines give a starting point: vendor-published 2026 guidance (Huaxin Machinery) puts a 1 t/h wood pellet line at roughly USD 90,000–130,000 in equipment and USD 150,000–200,000 all-in with civil works, electrical installation and commissioning, and quotes a real 5 t/h Vietnam project at about USD 285,000 total. Larger industrial lines cross the million-dollar mark. Treat these as configuration-dependent brackets, not quotations — automation level, drying requirement and the ratio of bought-in to in-house fabrication move them substantially.
What matters for the per-ton model is the amortization arithmetic. A USD 285,000 project written off over ten years spreads to USD 28,500 per year; on a 5 t/h line running 6,000 hours, that is just under USD 1/t. Run the same plant 2,000 hours a year because feedstock is unreliable and the figure triples. Capital recovery per ton is mostly a function of utilization, which is why the same machine can be cheap at one site and expensive at another. Add installation spares, a starter inventory of dies, screens and hammer sets, and working capital for feedstock purchases — a line this size typically needs several months of feedstock cash float, and the interest on that float belongs in the model.
Moisture: The Variable That Touches Every Line
It is worth a dedicated section, because moisture appears in four of the seven cost lines at once. Physics sets the floor: evaporating water takes roughly 2.6 MJ per kilogram (the latent heat of vaporization), so every percentage point of moisture removed from a ton of feedstock has a theoretical minimum energy cost before a single efficiency loss is added. Real rotary dryers run well above the theoretical minimum — INL’s 340 kWh/t equivalent for the drying stage reflects actual practice, including fan power and stack losses — but the floor explains why the drying bill scales almost linearly with the moisture you buy.
Moisture then works through the rest of the stack:
- Feedstock invoice: paying wet-basis prices for water, as the ¥400 → ¥571 correction above showed.
- Freight: every hauled ton of water is a hauled ton that produces nothing.
- Drying fuel and fan power: the dominant thermal load.
- Pellet mill performance: too dry and the material slips in the die, energy climbs and dies glaze; too wet and rollers slip and output falls. The pelleting window for softwood sawdust is narrow — typically a few points around 10–12% — which is why the dryer discharge moisture sensor is the most valuable instrument on the line.
The practical conclusion: a moisture guarantee clause in your feedstock contract is often worth more than a discount on the equipment. A supplier who delivers at 55% one week and 35% the next makes every downstream number in this article unstable, whatever the contract price says.
Building Your Own Model: The Inputs That Matter
Before requesting quotations, assemble these figures — they determine the per-ton cost far more than the equipment brand does:
- Feedstock: species mix, moisture band (not just an average), price basis (wet or dry), haul distance, seasonal availability, and a realistic contracted volume rather than the total theoretically available in the region.
- Energy: industrial electricity tariff (and its trend), fuel options for the dryer, whether waste heat or own fines can substitute.
- Market: target grade and price reference — utility bulk export or premium certified bagged — and the logistics cost to reach it.
- Site: labor rates, required automation level, civil works scope, and grid connection capacity.
- Operations: planned running hours, maintenance capability on site, and who supplies dies and rollers at what lead time.
Suppliers who quote without asking for most of this list are quoting a machine, not a plant. The per-ton cost of the same model of equipment can easily vary by 30–40% across two sites because of the inputs above.
A final calibration point: certified premium grades do not automatically pay their own way. Certification brings audit costs, tighter process control and often bagging investment, and it only earns its premium in markets that demand it. Decide the grade question as a market-access decision with numbers attached — the price spread in your target market against the added cost per ton — not as a quality ambition.
Key Takeaways
- Normalize every feedstock quote to dry matter. A 38%-moisture sawdust price hides a 40%+ penalty; the wet price is not the real price.
- Drying, not pelletizing, dominates energy. INL’s 340 kWh/t for rotary drying versus 49 kWh/t for the pellet mill should drive both your dryer selection and your siting decision near cheap fuel.
- Wear parts run USD 1–3/t at scale but calendar the die changes. Six unplanned stoppages a year cost more than the dies do.
- Scale buys ~5%, feedstock buys everything. The 500k vs 50k t/yr gap was €7/t; captive feedstock versus purchased can be €35–50/t.
- Check prices against EIA monthly data. $207.73/t export and $235.49/t domestic (June 2025) are the honest public benchmarks for your own model.
If you are budgeting a sawdust or wood pellet project and want the cost stack built against your actual feedstock moisture, tariffs and capacity, browse our biomass machinery range or send us your figures — we will return a per-ton model with the assumptions shown, not just an equipment price. For the design side of the same question, our wood pellet production line design guide covers capacity staging and equipment selection stage by stage.