
Almost every pellet plant payback figure we are shown by a prospective buyer is wrong in the same direction, and usually by a wide margin. It is rarely optimism about the selling price. The error sits earlier: the model compares a wet-tonne feedstock cost against a dry-tonne revenue, takes nameplate output as annual output, and treats electricity and drying heat as rounding items when in a real plant they are the second and third largest cost lines.
This guide rebuilds the arithmetic from published numbers. It uses US price data from the Energy Information Administration, European industrial electricity prices from Eurostat, the stage-by-stage electricity breakdown published in IEA Bioenergy work, and an investment cost table from IRENA. Where a number is local and cannot be sourced — feedstock price, labour, your own capital quotation — it is labelled as an input, and the sensitivity table shows how much each one is allowed to move before the project stops working.
Where Payback Models Usually Break
Three mistakes account for most of the gap between a spreadsheet and a bank.
The first is moisture basis. Feedstock is bought wet and pellets are sold at 8 to 10% moisture. If the model multiplies tonnes of sawdust by a wet price and compares that against a pellet price, it understates feedstock cost by the whole mass of water that has to be evaporated and paid for twice — once at the gate, once in the dryer.
The second is capacity. A mill rated at 5 t/h does not produce 5 t/h for 8,000 hours. It produces close to that figure on a good day, on a specified feedstock, at a specified moisture, with a die that is not worn. Annual output is nameplate multiplied by operating hours multiplied by an availability factor that a new plant will not hit in its first year.
The third is the energy line. In a wet-feed line, drying and grinding together consume more electricity than the pellet mill itself, and the drying heat is a separate fuel cost that never appears on the electricity bill. A model that budgets “power” as one number per tonne hides the only part of the process an operator can still change after commissioning.
The Four Inputs That Decide Everything
Strip away the spreadsheet and a pellet plant has four drivers: the net price received per tonne, the cost of feedstock per dry tonne, the energy consumed per tonne, and the capital spent to build the line. Everything else — labour, maintenance, administration, port charges — is either small or scales with these four.
Ranked by how much damage a 20% error does, price comes first, feedstock second, throughput third, capital fourth. That ranking is uncomfortable, because three of the four are outside the equipment supplier’s control. It is also the reason a serious feasibility study spends more time on offtake contracts than on machine selection.
Start With the Price You Can Actually Get
The most defensible price anchor available in public data is the EIA’s monthly densified biomass survey, which separates domestic sales from exports. In August 2026, US manufacturers sold 0.14 million tons domestically at an average of $246.98 per ton and exported 0.71 million tons at an average of $203.25 per ton, out of total production of 0.94 million tons from 74 operating plants with 13.2 million tons of annual capacity (EIA Monthly Densified Biomass Fuel Report).
Two things follow. First, the domestic-to-export spread of roughly $44 per ton is not a market anomaly; it is the cost of getting pellets to a customer who is further away, plus the difference between bagged retail-adjacent sales and bulk utility supply. Second, an export price is a CIF or FOB number, and the seller pays for the difference either way.
IEA Bioenergy’s cost work puts names on that difference for a European delivery: inland truck or rail to port at around $10 per tonne per 100 km, port storage at about $0.14 per tonne per day, loading at $2.86 per tonne, and deep-sea shipment at roughly $35 per tonne. A plant holding 45 days of stock in port before a vessel sails has already spent $6.30 per tonne on storage alone, before the freight line.
When a buyer tells us pellets sell for $200 per tonne, the first question is where. FOB plant, FOB port and CIF Rotterdam are three different businesses with the same product.
The second question is how the price is set. Industrial offtake is usually indexed rather than fixed — to a published pellet index, to coal, or to a basket that includes freight — and the indexation clause decides who absorbs a bad year. A contract with a floor and a collar produces a bankable model; a contract with a headline price and an annual renegotiation produces a spreadsheet that cannot be financed. If the only price available is the spot market, model the ten-year average rather than the best month, and treat the difference as risk capital.
Feedstock Cost Has to Be Normalised to Dry Tonnes
This is the step that most often decides whether a project is viable, and it takes one line of arithmetic. A pellet at 8% moisture is 92% dry matter. Feedstock at 40% moisture is 60% dry matter. To put one tonne of dry matter into the pellet mill you therefore need 1 divided by 0.6, or 1.67 wet tonnes; to make one tonne of finished pellet containing 0.92 tonnes of dry matter you need 1.53 wet tonnes.
The same ratio appears in IRENA’s pellet plant case, which assumes 255,000 green tonnes of feedstock at 50% moisture to produce 123,800 tonnes of pellets — just over 2 wet tonnes per tonne of output, because the feedstock there is wetter than typical sawdust.
The practical consequence: a supplier quoting $60 per wet tonne at 40% moisture is quoting $100 per dry tonne. A competitor quoting $75 per wet tonne at 25% moisture is quoting $100 per dry tonne as well, and delivers 1.23 wet tonnes per tonne of pellets instead of 1.53, which removes 0.3 tonnes of water per tonne of product from the dryer. The cheaper-looking quote is the more expensive one.
Electricity: 171 kWh per Tonne Before You Add Anything
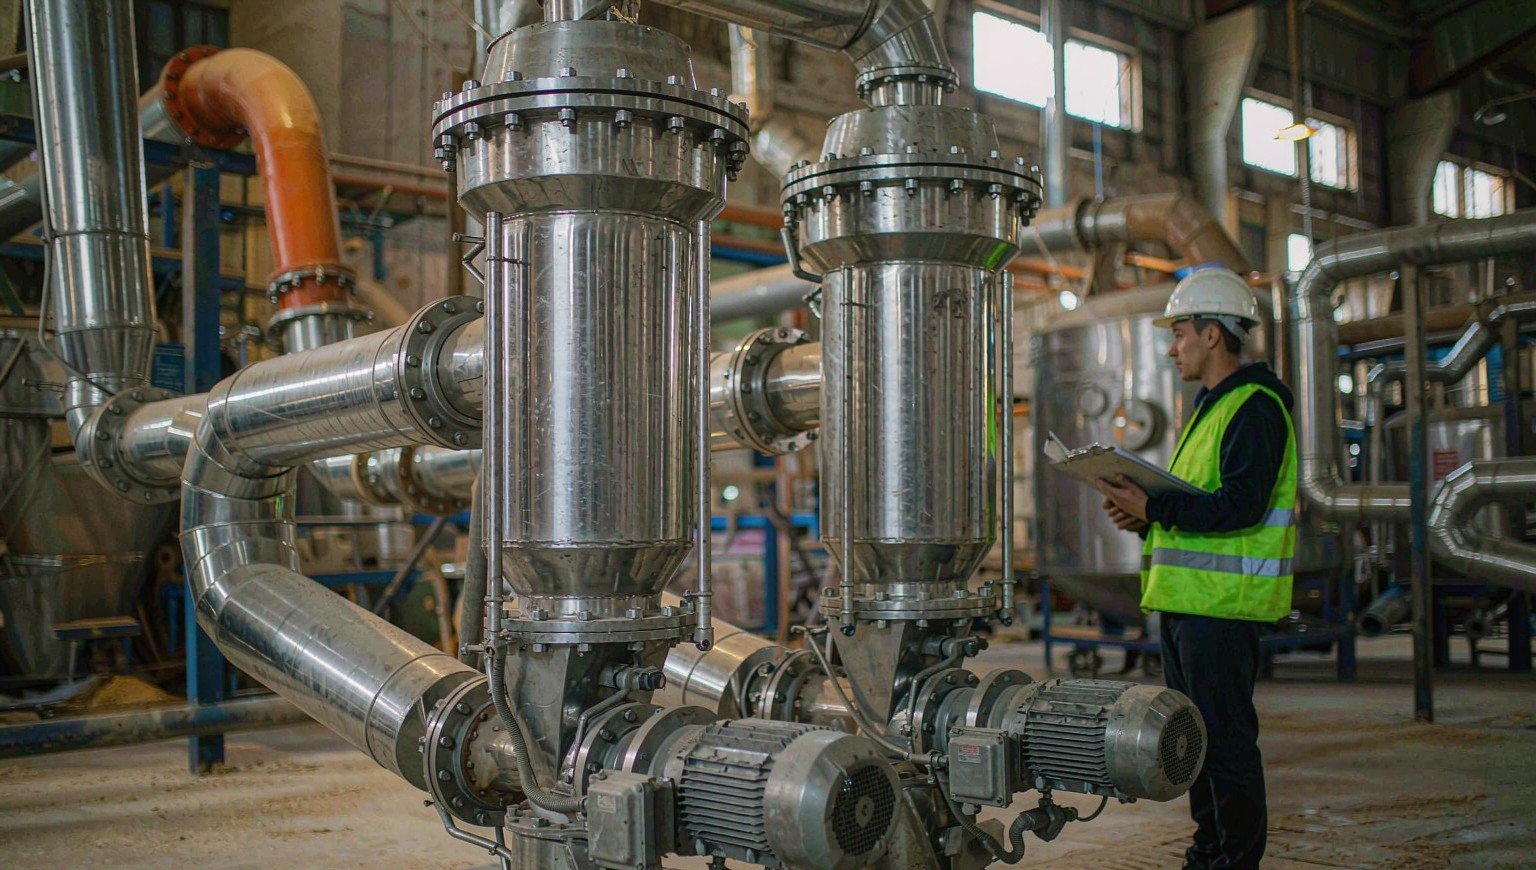
Published stage-by-stage figures for a conventional wet-feed pellet plant add up to 171 kWh per tonne of product: 20 kWh in the wood yard, 45 kWh in the pre-dryer, 50 kWh in the hammer mills and 56 kWh in the pellet mills (IEA Bioenergy Task 32 review, using the Koppejan case; the same 171 kWh/t figure appears in IRENA’s solid biomass supply report). That number is a European configuration: it assumes a pre-dryer and two grinding stages, and it excludes drying fuel.
| Process stage | kWh per tonne of pellet | What drives it | Where the waste hides |
|---|---|---|---|
| Wood yard (chipping, handling) | 20 | Log size, chipper condition, conveyor runs | Idle running conveyors, worn chipper blades |
| Pre-dryer (fans, drives) | 45 | Air volume, drum or belt type, inlet moisture | Over-drying below target moisture |
| Hammer mills | 50 | Screen size, tip speed, feedstock species | Grinding finer than the die needs |
| Pellet mills | 56 | Die compression ratio, roller gap, feed rate | Running below design throughput |
| Total (excluding drying fuel) | 171 | Configuration and feedstock | Poor moisture control upstream |
Multiply 171 kWh by the industrial tariff and the geography problem becomes visible. Eurostat puts the EU average non-household electricity price at €0.1800 per kWh in the first half of 2026, with Italy at €0.2253 and Finland at €0.0928 for medium-sized industrial users (Eurostat electricity price statistics). The same machine, making the same pellet, spends €30.78 per tonne in the EU average case and €15.87 per tonne in Finland. On 35,000 tonnes a year, that is a difference of more than half a million euros annually for identical equipment.
For a plant in Southeast Asia or West Africa paying $0.10 to $0.12 per kWh, electricity lands near $17 to $21 per tonne. This is why the same Chinese line that is marginal in Germany is comfortable in Vietnam, and why tariff negotiation belongs in the feasibility study next to the feedstock contract.
Drying Heat Is the Cost Nobody Quotes
Drying fuel usually sits outside the equipment quotation entirely, because burners, furnaces and heat exchangers are often sourced locally. It is still the second-largest energy cost in a wet-feed plant.
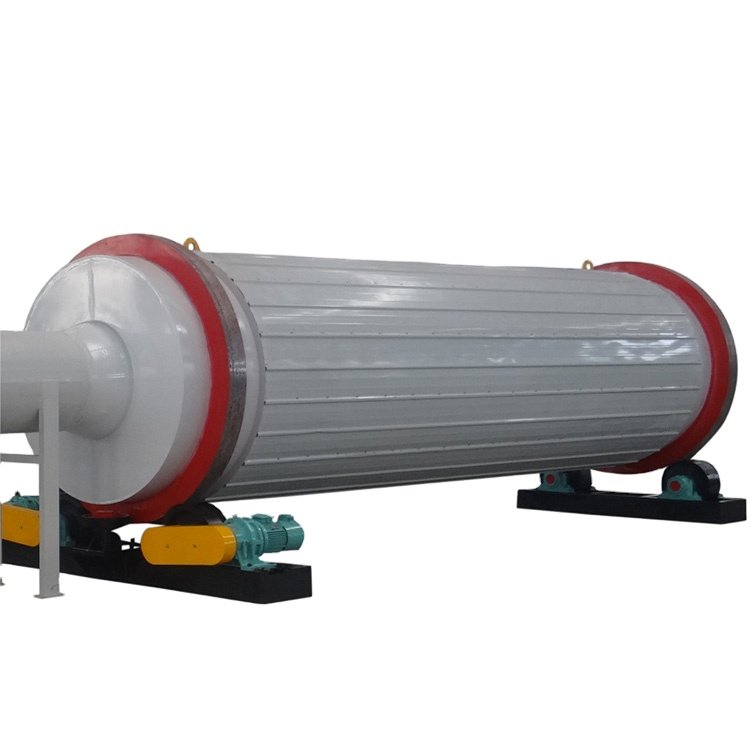
The mass of water to remove follows directly from the moisture figures. In the 1.53 wet tonne example above, one tonne of pellets requires evaporating 0.53 tonnes of water. Published drying measurements for wood report 3,600 to 3,960 MJ per tonne of water evaporated once real dryer efficiency is included, so the thermal demand is roughly 1,900 to 2,100 MJ per tonne of pellets. Burn that heat from pellet fines or low-grade biomass at 17.5 GJ per tonne and 85% furnace efficiency, and the fuel bill is around 0.13 tonnes of biomass per tonne of product.
Where that biomass is free — bark, fines, off-spec material — drying costs almost nothing in cash and a great deal in yield. Where it has to be bought at pellet-grade prices, drying quietly becomes a $8 to $15 per tonne line, and over-drying to 6% instead of 9% adds another 3 to 4% of fuel for a product that then has to be re-moisturised or sold with a moisture penalty. Dryer control is a revenue issue, not only an energy one; the mass balance behind it is worked through in our note on where the water in wood pellets comes from and how to take it out.
A Worked Example: 5 t/h, 7,000 Hours
Here is the arithmetic assembled into a single year, for a line rated at 5 t/h running 7,000 hours and producing 35,000 tonnes. Published anchors are marked; the rest are inputs a buyer replaces with local quotes.
| Line item | Basis | Per tonne (USD) | Annual (USD) |
|---|---|---|---|
| Revenue, FOB plant | 35,000 t at $200; EIA export average was $203.25/t in Aug 2026 | 200.00 | 7,000,000 |
| Feedstock | 1.53 wet t at $60 input price, 40% moisture | 91.80 | 3,213,000 |
| Electricity | 171 kWh at $0.12/kWh | 20.52 | 718,200 |
| Drying fuel | 0.13 t biomass at $60/t | 7.80 | 273,000 |
| Labour | 20 people, input wage | 3.43 | 120,000 |
| Maintenance and wear parts | 2.5% of $4.2M equipment value | 3.00 | 105,000 |
| Administration, insurance, quality | 4% of investment, IRENA method | 7.43 | 260,000 |
| Inland transport to port | 100 km at $10/t per 100 km | 10.00 | 350,000 |
| Cash cost | Sum of the above | 143.98 | 5,039,200 |
| EBITDA | Revenue less cash cost | 56.02 | 1,960,800 |
| Simple payback | $6.5M investment divided by EBITDA | 3.3 years | — |
Three points about this table. It excludes depreciation, interest and tax, so it measures cash recovery, not accounting profit; an after-tax payback at a 25% rate lands roughly 20 to 25% longer. It assumes the plant runs at 88% of nameplate hours, which is optimistic for year one. And the $6.5 million investment is an input, not a benchmark: it covers equipment, installation, civils and utilities for a line of this size, and the actual figure depends on how much of the site already exists.
What Actually Moves Payback
Each variable below is moved 20% from the base case in the table above, with everything else held constant.
| Variable moved | New EBITDA (USD) | Payback on $6.5M | What it means |
|---|---|---|---|
| Base case | 1,960,800 | 3.3 years | Reference point |
| Price −20% ($160/t) | 560,800 | 11.6 years | Price does not just matter, it dominates |
| Price +20% ($240/t) | 3,360,800 | 1.9 years | Same plant, double the return |
| Feedstock −20% ($48/t) | 2,603,400 | 2.5 years | A feedstock contract beats a machine upgrade |
| Feedstock +20% ($72/t) | 1,318,200 | 4.9 years | Still bankable, but thin |
| Electricity ±20% | 2,104,400 / 1,817,200 | 3.1 / 3.6 years | Real, but rarely the deciding factor |
| Output 30,000 t (−14%) | 1,611,400 | 4.0 years | Fixed costs get spread over fewer tonnes |
| Investment $8.5M instead of $6.5M | 1,960,800 | 4.3 years | Overbuilding the line costs one year |
The ranking is unambiguous. A 20% price move changes payback by a factor of three; a 20% electricity move changes it by half a year. Buyers spend most of their diligence on machines and almost none on offtake, which is precisely backwards.
The combinations matter more than the individual moves. Price 20% down and feedstock 20% up in the same year produces an EBITDA of roughly minus $80,000 — the plant still runs, because most of its cost is variable, but it stops recovering capital. Price down 20% with output at 65% during ramp-up is the scenario that breaks new producers, and it is not a tail event: it is the first year of a plant commissioned into a soft market.
Wear parts deserve a line of their own because they are the only operating cost that scales with abrasive feedstock rather than with output. A plant running high-ash material spends more on dies and roller shells per tonne than one running clean softwood, and a model built on softwood consumption understates maintenance for a residue-fed line. Ask for consumption in grams per tonne at your ash level, and put that figure in the cash cost table rather than in a contingency.
Capital Cost per Annual Tonne
The most useful public capital benchmark for a pellet plant remains IRENA’s 2019 case: $19.5 million for a plant taking in 255,000 green tonnes and producing 123,800 tonnes per year, split into $5.0 million for the wood yard, $4.5 million for the pre-dryer, $2.0 million for hammer mills, $4.0 million for pellet mills, $1.0 million for silos and $3.0 million for civil works. That works out at roughly $157 of investment per annual tonne of output, with operating and maintenance at 2% of investment and other costs at 4%.
Two caveats keep that number honest. It is a European 2019 cost basis, so steel, labour and civil works have all moved since. And it describes a plant at a scale where the wood yard, civils and laboratory are spread over 123,800 tonnes; at 35,000 tonnes the same site infrastructure is spread over a quarter of the output, which is why small plants routinely carry $200 to $250 per annual tonne even when the machines cost less per unit.
The component split is the more valuable part of the table. It says that roughly half the capital is not in the pellet mills at all — it is in feedstock handling, drying and civils. A quotation that lists only mills, cooler and bagging line is not a plant quotation. Our own line design note sets out the balance-of-plant scope that has to be priced with it.
Working Capital and the Ramp-Up Year
Two cash items sit outside the EBITDA line and both are routinely forgotten.
Working capital is the larger. A plant buying feedstock 60 days ahead of production and selling on 30-day terms is financing 90 days of cost — at $144 per tonne and 100 tonnes a day, that is around $1.3 million tied up before the first invoice is paid. Add one full set of wear parts and a month of spares and the figure grows.
Ramp-up is the second. Very few lines reach design output in month one. A realistic first-year model uses 60 to 70% of steady-state output, with the gap absorbed by die bedding-in, operator learning, moisture control and the inevitable conveyor that was sized for the wrong material. On the worked example, a first year at 65% output removes roughly $700,000 of EBITDA — most of a year of payback, spent before the plant has done anything wrong.
If the project is debt-financed, both items turn into a coverage test. A lender will divide cash available for debt service by the scheduled repayments and want a margin above 1.2 in the worst modelled year, not the average year. On the worked example, EBITDA of $1.96 million against a $6.5 million facility over seven years at 8% carries roughly $1.25 million of annual service, which clears the test in the base case and fails it if price drops 20%. That is the number to compute before signing a supply contract, because it tells you which downside you can survive.
What to Ask a Supplier Before You Trust Their Model
The equipment supplier cannot fix the price or the feedstock contract, but it can be held to numbers that make the model testable. Ask for these in writing:
Specific energy at a stated moisture and die specification. “Low power consumption” is not a figure. A guaranteed kWh per tonne at 12% inlet moisture, a named die compression ratio and a named screen size is.
Output guarantee and its test basis. Capacity should be quoted per mill at a defined feedstock, moisture and bulk density, with the acceptance test method written into the contract. Our cost per tonne breakdown shows how much of the model depends on that number being real.
Wear part consumption in grams per tonne, not hours. Hours depend on how hard the plant runs; grams per tonne is a cost the finance model can use directly.
Installed power and simultaneity factor. The transformer size is a capital item, and suppliers who quote connected load without a simultaneity factor leave the buyer paying for capacity that is never drawn.
A spare parts list with lead times. One ring die stranded in customs for six weeks costs more than the die. The spare parts range and the mill itself should be quoted in the same document, with the biomass pellet mill specification stated at the same moisture basis used in the energy guarantee.
Dryer heat balance. Evaporation capacity in kg of water per hour, at a stated inlet and outlet moisture, with the fuel consumption that goes with it. If the dryer is bought separately, someone has to own the interface — and that someone is usually the buyer.
Bottom Line
A pellet plant payback is not a single number produced by a supplier’s spreadsheet. It is the output of four inputs, only one of which the equipment supplier controls, and the honest version of the model shows the other three moving.
Price dominates. A 20% move in the net price per tonne swings payback between 1.9 and 11.6 years on the same plant, which is why offtake terms deserve more diligence than motor brands. Feedstock is second, and it has to be compared on a dry-tonne basis or the comparison is meaningless. Energy is third, and the 171 kWh per tonne published for a conventional line is the number to beat, not a worst case. Capital is fourth, and it is roughly half balance-of-plant, which is where under-specified quotations hide.
Run the model with your own four numbers before you approve a layout. If payback only works at the optimistic end of every input, it does not work.