

Every pellet quality conversation sooner or later produces a number like “93.5 PDI.” It gets compared against last week’s number, against the other mill’s number, sometimes against the customer’s specification. But the number is often quoted with more confidence than it deserves, because what it measures — and what it does not — depends entirely on which test produced it, how the sample was handled, and when it was taken. This article explains what pellet durability index (PDI) actually measures, how the standard methods differ, where the measurement itself is fragile, and which plant variables move it most.
What PDI Actually Measures
PDI is a survival rate, not a strength value. A sample of finished pellets is subjected to a standardized mechanical stress, then sieved; the index is the mass of intact pellets remaining, expressed as a percentage of the starting mass:
PDI = (mass after tumbling ÷ mass before tumbling) × 100
The lost mass is fines — broken pellet fragments and abrasion dust. That is why a PDI of 93 means 7% of the sample failed the simulated handling, and why PDI correlates directly with the fines your customer sweeps out of the silo. It is also why PDI is a predictive indicator: it simulates handling stress in a can or an air jet, and the correlation with real-world fines depends on how well the test’s stress resembles your actual conveyors, trucks and farm bins.
The Standard Test: The Tumbler Method
The method most North American feed mills use is defined by ASAE Standard S269.5. Kansas State University’s extension fact sheet on evaluating pellet quality lays out the procedure precisely: a 500 g sample of pellets is sieved to remove fines, placed in a dust-tight tumbling can with an internal baffle, and rotated for 10 minutes at 50 rpm around an axis perpendicular to the can’s 12-inch sides. After tumbling, the sample is sieved again on a wire sieve with openings just smaller than the nominal pellet diameter, and durability is the percentage of whole pellets retained.
Three procedural details carry more weight than most labs realize. First, the pellets should be tested immediately after cooling — the standard considers pellets “cool” when they are within ±10 °F of ambient, and delayed tests are reported with a subscript (a sample at 95% tested four hours after cooling is written (95)₄). Second, the sieve size matters less for its absolute value than for its consistency: the same screen before and after defines what counts as a fine. Third, the starting mass must be exact, and the standard calls for replicate tests, because sample-to-sample variation in a single run is real.
Why the Number Is Fragile
The tumbler method looks simple, and that simplicity is where its weaknesses live. Pacheco and Stark reported that simply changing the starting sample weight changed the result: starting with 300, 400, 500 and 600 grams of whole pellets produced PDIs of 87, 88, 89 and 90 percent respectively — a three-point spread from a 300 g difference in sample weight, with nothing else altered. When the test was modified with two hex nuts to increase abrasion, the spread widened dramatically (47, 60, 70 and 76 percent for the same weights). The full background of these method sensitivities is documented in a Pellet Fuels Institute industry thesis on wood pellet durability, which also catalogs the impact-resistance and Dural tester variants.
Two further fragilities deserve mention. The test has limited discriminating power: visually different feeds can land within a point of each other, which is why some mills add ball bearings or hex nuts — a modification that increases sensitivity but destroys comparability between plants and instruments. And PDI says nothing about where fines will actually be generated: a pellet that survives the tumbling can may still break across four drop points in the loading system, a pneumatic truck line, and a farm silo fill. The index is a controlled simulation, not a field measurement.
What Actually Drives PDI in the Plant
The levers are well studied, and most of them are process variables rather than capital purchases. Kansas State’s work and the wider literature point to conditioning first: raising conditioning temperature from 74 to 85 °C improved PDI linearly in corn-soy diets without increasing energy consumption, and the classical rule of thumb is that mash moisture rises roughly 1% for every 14 °C of conditioning temperature — moisture acting as a binder and plasticizer. Die L:D works in the same direction: raising it from 5.6 to 8 improved pellet quality in KSU trials, and in the 2017 reduced-fat DDGS study cited earlier, moving from an L/D 5.5 die to an L/D 10.0 die lifted Holmen PDI from 87.10 to 93.27, while faster die speed (254 vs. 166 rpm) added another point and a half. On the other side of the ledger, added fat lubricates the die and softens pellets — fat beyond roughly 2% is typically post-applied after the mill rather than mixed in before it, precisely to protect pellet quality.
Die wear operates quietly and in reverse: as die holes wear and polish, backpressure falls and PDI drifts down over weeks until someone notices fines in the bag. Tracking PDI against tons-through-die turns that drift into a scheduled die change instead of a customer complaint.
| Lever | Mechanism | Evidence / typical effect | Cost side |
|---|---|---|---|
| Raise conditioning temperature | Moisture +1% per ~14 °C; starch gelatinization, protein plasticization | 74→85 °C improved PDI linearly, no energy penalty (KSU) | Steam system capacity; boiler fuel |
| Longer conditioner retention | More complete moisture/heat absorption before the die | Supports the temperature effect; most valuable on high-DDGS or high-fiber diets | Retrofit only if current retention is short |
| Thicker die / higher L:D | Longer pressure retention and friction in the hole | 5.6→8 improved quality (KSU); 87.1→93.3 PDI at L/D 5.5→10 (DDGS study) | Higher kWh/t; lower throughput at same power |
| Finer, more uniform grind | Denser compaction, more contact area for binding | Particle size interacts with every other lever | Grinding energy; see our screen size selection guide |
| Post-pelleting liquid fat application | Keeps lubricant out of the compression zone | Standard practice above ~2% fat inclusion | Coating equipment and accuracy control |
| Die and roller management | Maintains designed backpressure; prevents wear-driven PDI drift | PDI tracked against tons-per-die catches the drift | Spare die inventory; planned stop for changes |
What Number Is Good Enough?
For biomass pellets the answer is written down: ISO 17225-2 sets mechanical durability at 97.5% minimum for the top grades, and ENplus raises the bar to 98.0% for its A1 class — the scheme’s scope and testing requirements are described on the ENplus certification site. Durability is policed hardest where pellets trade across borders, a market context tracked by IRENA’s bioenergy programme. Feed has no equivalent universal grade, so mills set internal specifications based on their customers’ fines tolerance and their own handling chain. What matters for either product is the same: a PDI target only means something if the test method, sample weight, sieve and timing are fixed and written down, and if the number is read against the field data — fines at unloading, complaints from the farm — rather than in isolation.
Handling after the mill destroys durability just as effectively as a bad die. Every drop point, transfer and pneumatic push adds abrasion; gentle transfer and correct cooler discharge settings preserve what the mill created. Our article on the counterflow cooler working principle covers one of the critical hand-off points between pelleting and storage, and the counterflow cooler product page shows how the discharge is engineered to avoid pellet breakage at the exit.

Comparison Recap: Tumbler vs. Holmen — Which Test Should Your Mill Report?
Two families of test dominate the industry, and they stress pellets differently. The tumbler can (ASAE S269.5) simulates screw and mechanical conveyance through tumbling contact; the Holmen tester blows air through the sample to simulate pneumatic handling, which is common in European pellet logistics. Because the stress regimes differ, the numbers are not interchangeable, and comparing a tumbler PDI from one plant against a Holmen figure from another tells you nothing.
| Attribute | Tumbler can (ASAE S269.5) | Holmen (air-blow type) |
|---|---|---|
| Stress regime | Tumbling impact and abrasion with internal baffle | Air-jet abrasion in a perforated chamber (pneumatic-type) |
| Sample size / duration | 500 g, 10 min at 50 rpm | 100 g, ~30–60 s blow (model-dependent) |
| Best match to | Mechanical conveying, US-style bulk handling | Pneumatic conveying and European pellet logistics |
| Strengths | Long standard history; simple, low-cost equipment; widely reported in feed | Faster; better discrimination on hard, dense pellets; standard in wood pellet QC |
| Watch-outs | Sample-weight and sieve sensitivity; low discrimination without modification | Model-specific settings must be recorded; results not comparable to tumbler values |
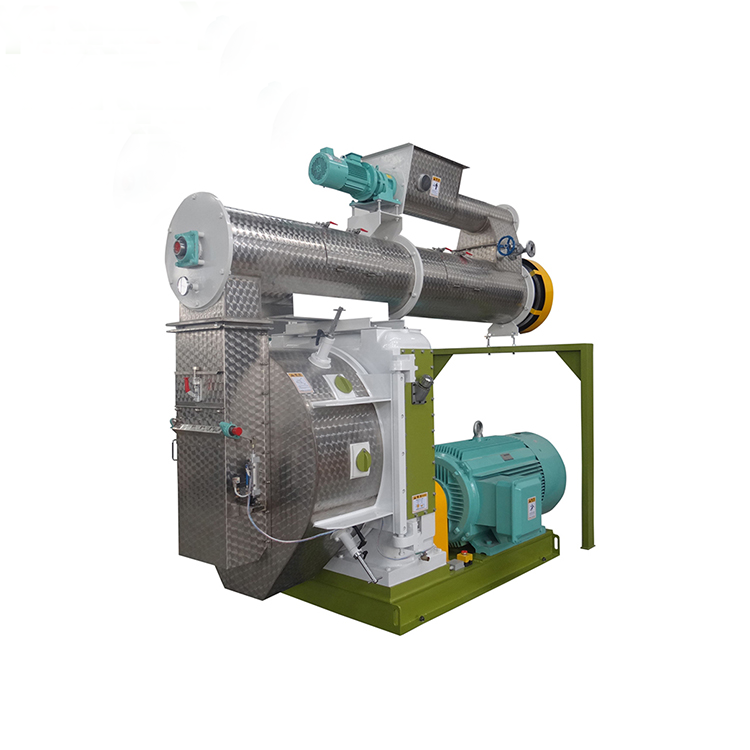
The practical answer to “which one” is: the one your customer measures, and failing that, the one that resembles your delivery chain. Whichever you choose, freeze the procedure — sample weight, sieve, timing, replication — and treat any change to it as a change of unit, not a change of habit. A PDI recorded under a fixed method, trended against die wear and conditioning data, will tell you more about your line than any single number ever will. For the grinding side of the same quality chain, see our guide on hammer mill screen size selection, and for the mill that produces the pellets themselves, our poultry and livestock feed pellet mill page lists the conditioning and die configurations behind the numbers above.